1Km Distribution Models, commissioned by IAEA and FAO
in support of PATTEC
These maps were produced using
multivariate analysis (logistic regression) to establish statistical
relationships between the best estimate of the presence of the fly (‘observed’
or ‘training’ distributions largely derived from the Ford and Katondo series
from the 1970's), and a series of potential predictor variables including
agricultural, environmental, climatic, demographic and topographic parameters.
The statistical relationships are used to prepare 1km resolution predictions of
fly distribution. These maps are of the probability of presence, which allows a
significantly more refined assessment of risk than the simple presence or
absence estimates used to define the models. They may also highlight areas which
the original maps did not identify as suitable for the fly, and as well as those
which were defined as suitable but are not. The methods used to produce the West
Africa and Uganda are reported in Wint (2001)
and were used with only minor modifications for the other areas. The maps were
produced as drafts, to be updated when sufficient systematic transect based
collections of fly distribution data are available.
Enquiries to
William Wint
These are the files as produced for the International
Agencies - Click on Thumbnails to download png graphic, or pdf for pdf
format. Files are A3 when printed. Re-designed graphics and the 1km resolution
GIS format files can be downloaded from
FAO PAAT
| West Africa |

pdf
G. palpalis |
|

pdf
G. tachinoides |
|
|
| Uganda |
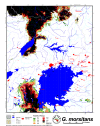
pdf
G. morsitans |
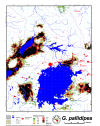
pdf
G. pallidipes |
|
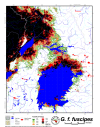
pdf
G. fuscipes |
|
| Ethiopia |
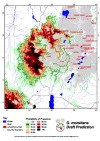
pdf
G. morsitans |
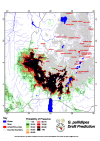
pdf
G. pallidipes |
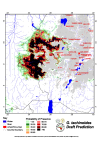
pdf
G. tachinoides |
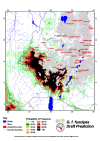
pdf
G. fuscipes |
|
| Kenya and Somalia |

pdf
G. morsitans |

pdf
G. pallidipes |

pdf
G. austenii |

pdf
G. swynnertoni |
|
| Tanzania |
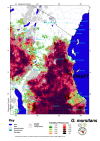
pdf
G. morsitans |
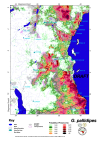
pdf
G. pallidipes |
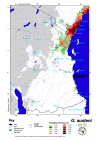
pdf
G. austenii |
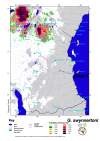
pdf
G. swynnertoni |
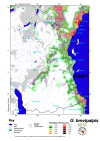
pdf
G. brevipalpis |
| Botswana, Zimbabwe and Mozambique |

pdf
G. morsitans |
|
|
|
|
[ Home ] [ Methods ] [ 1km Distribution Models ] [ 5 km Distributions ]


